Visualizing Hacker News stories using Elasticsearch & Kibana
Introduction
Over at Hacker News items such as stories (but also comments, jobs, polls ) are added every second.
A story is represented by a title and a URL. A users karma (no. points) are roughly, the number of upvotes on their stories and comments minus the number of downvotes.
I wanted a better way of displaying the popularity of a Hacker News story.
I chose Elasticsearch to index the data as it’s dead easy to setup and use. Alongside Kibana to visualize the data, I had a working solution up and running in less than a day.
HN API
Hacker News provides a RESTful API which makes data available in near real time.
The base URI for the API is https://hacker-news.firebaseio.com/v0
| Endpoint | Description |
|---|---|
/topstories.json?print=pretty |
Returns top stories (~500) |
/newstories.json?print=pretty |
Returns new stories (~500) |
/item/\<id>.json?print=pretty |
Returns story information |
Top stories
Making a request for the top stories returns the following JSON.
These are all story IDs.
  [
    22815453, 22813565,
    22792242, 22813908,
    22811653, 22815227,
    22815112, 22813834,
    22815731, 22812312,
    22815713, 22810514,
    22813574, 22811634,
    22815269, 22794603,
    22791788, 22804079
  ]
New stories
Making a request for the new stories again returns an array of story IDs.
Story information
Here we can get more information regarding a particular story posted on HN.
The URI can be built up using the top/new story ID.
e.g. https://hacker-news.firebaseio.com/v0/item/22813908.json?print=pretty
This returns the following JSON.
  {
    "by" : "shortj",
    "descendants" : 47,
    "id" : 22813908,
    "kids" : [ 22815121, 22815383, 22814200, 22815940, 22815951, 22815605, 22815999, 22815381, 22814987, 22815964, 22815312, 22815889, 22816003 ],
    "score" : 114,
    "time" : 1586360523,
    "title" : "Rules for Data Modeling with DynamoDB",
    "type" : "story",
    "url" : "https://www.trek10.com/blog/the-ten-rules-for-data-modeling-with-dynamodb"
  }
More information can be found at https://github.com/HackerNews/API
Docker containers
Both Elasticsearch and Kibana are setup within docker containers
docker-compose file
version: "3.7"
networks:
    default:
      driver: bridge
      name: devops

services:
  elasticsearch:
    restart: always
    image: elasticsearch:7.6.2
    ports:
      - "9200:9200"
      - "9300:9300"
    environment:
      discovery.type: single-node

    container_name: elasticsearch

  kibana:
    restart: always
    image: kibana:7.6.2
    ports:
      - "5601:5601"
    container_name: kibana
- Elasticsearch docker container
Using a single node discovery type means that there is only 1 master here and this will not join a cluster with another node.
This serves the purpose for development/testing.
Elasticsearch APIs
Create index API
Adds a new index ‘hn-new’ into a Elasticsearch cluster. This index will be used for all HN New stories.
curl -X PUT "<el-host>:9200/hn-new/"
Index mappings
The mappings allows fields inside an index.
- title = HN story title - type = keyword
- url = the link to where the story resides on the web - type = keyword
- score = the no. points currently accumulated - type = integer
- id = the HN story id - type = integer
- added = the timestamp on when the HN story was posted - type = keyword
The keyword type ensures we can filter on those fields.
curl -X PUT "<el-host>/hn-new/_mapping/" -H 'Content-Type: application/json' -d'
    {

        "properties" : {
            "title" : { "type": "keyword" },
            "url": { "type" : "keyword" },
            "score": { "type" : "integer" },
            "id": { "type" : "integer" },
            "added": { "type" : "keyword" }
          }
}
'
Document API
Use this API to add a JSON document to the specified index and also makes it searchable.
PUT /<index>/_doc/<_id>
The <_id> should be a unique identifier and for this I used the HN story ID - since each story ID is unique.
JSON document
With Python I made a HTTP PUT request with a JSON data payload. This payload consisted of.
  {
      "title":"Google’s former CEO hopes coronavirus makes people more “grateful” for Big Tech",
      "url":"https://www.vox.com/recode/2020/4/14/21221141/coronavirus-eric-schmidt-google-big-tech-grateful",
      "score":1,
      "id":22876051,
      "added":"2020-04-15 09:57:24"
  }
Kibana
To visualize the data.
Create index pattern
- Management > Index patterns


Enter the index pattern to match.
In this example I used hn-new and hn-top since these are the 2 indexes I created.
Discover
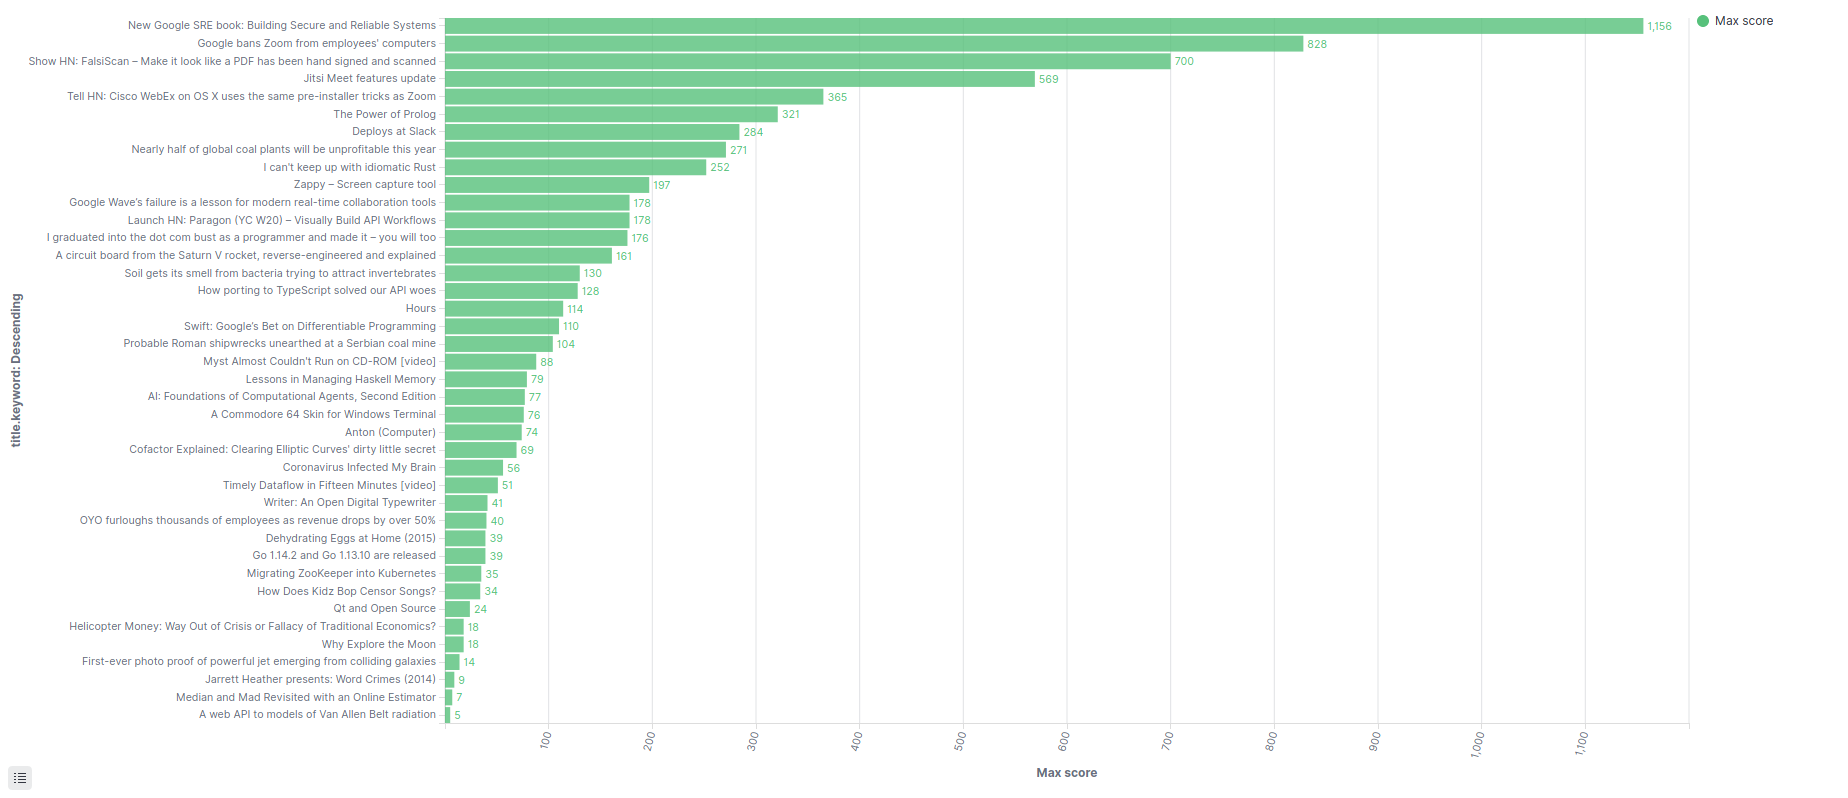
I chose a horizontal bar chart in this example.
Data


Metrics & axes

Panel settings

Python script
- Makes a request for the Top & New HN Stories
- Indexes the story data in Elasticsearch
More Kibana examples
Line graph

Table

Heatmap
